Product
Platform Updates: Event Anomalies, Destination Signals, Heatmap Export & Element Analytics, and Tag Manager Consent Integration

I've spent more time than I'd like to admit over the past year staring at raw event logs trying to figure out why numbers looked off. A property that was always a number suddenly shows up as a string. A website editor removes an element that was capturing a trigger and suddenly event volume drops by half. Facebook conversions are dispatching fine, but half of them are missing the FBC cookie, so they never get attributed. Every one of these is a real thing we've debugged, and every one of them was harder to find than it should have been.
That's the thread running through this release. We built the reports we wished we had during those debugging sessions. Anomaly detection that would have caught the schema drift before it corrupted a week of analytics. Signal reports that would have shown us the attribution gap in five seconds instead of an hour of digging. And heatmap improvements that make it easier to pull aggregated, anonymized insights out and share them with people who don't live in the platform.
Here's what's new:
Event Anomaly Detection
Someone on the marketing team updates a landing page. A form gets restructured, a button gets renamed, a third-party script gets swapped out. Nothing seems wrong. But your most important conversion event just fell off a cliff, and nobody knows for two weeks until someone pulls a report and the numbers don't make sense.
Two new reports live under Data Governance to catch these problems early:
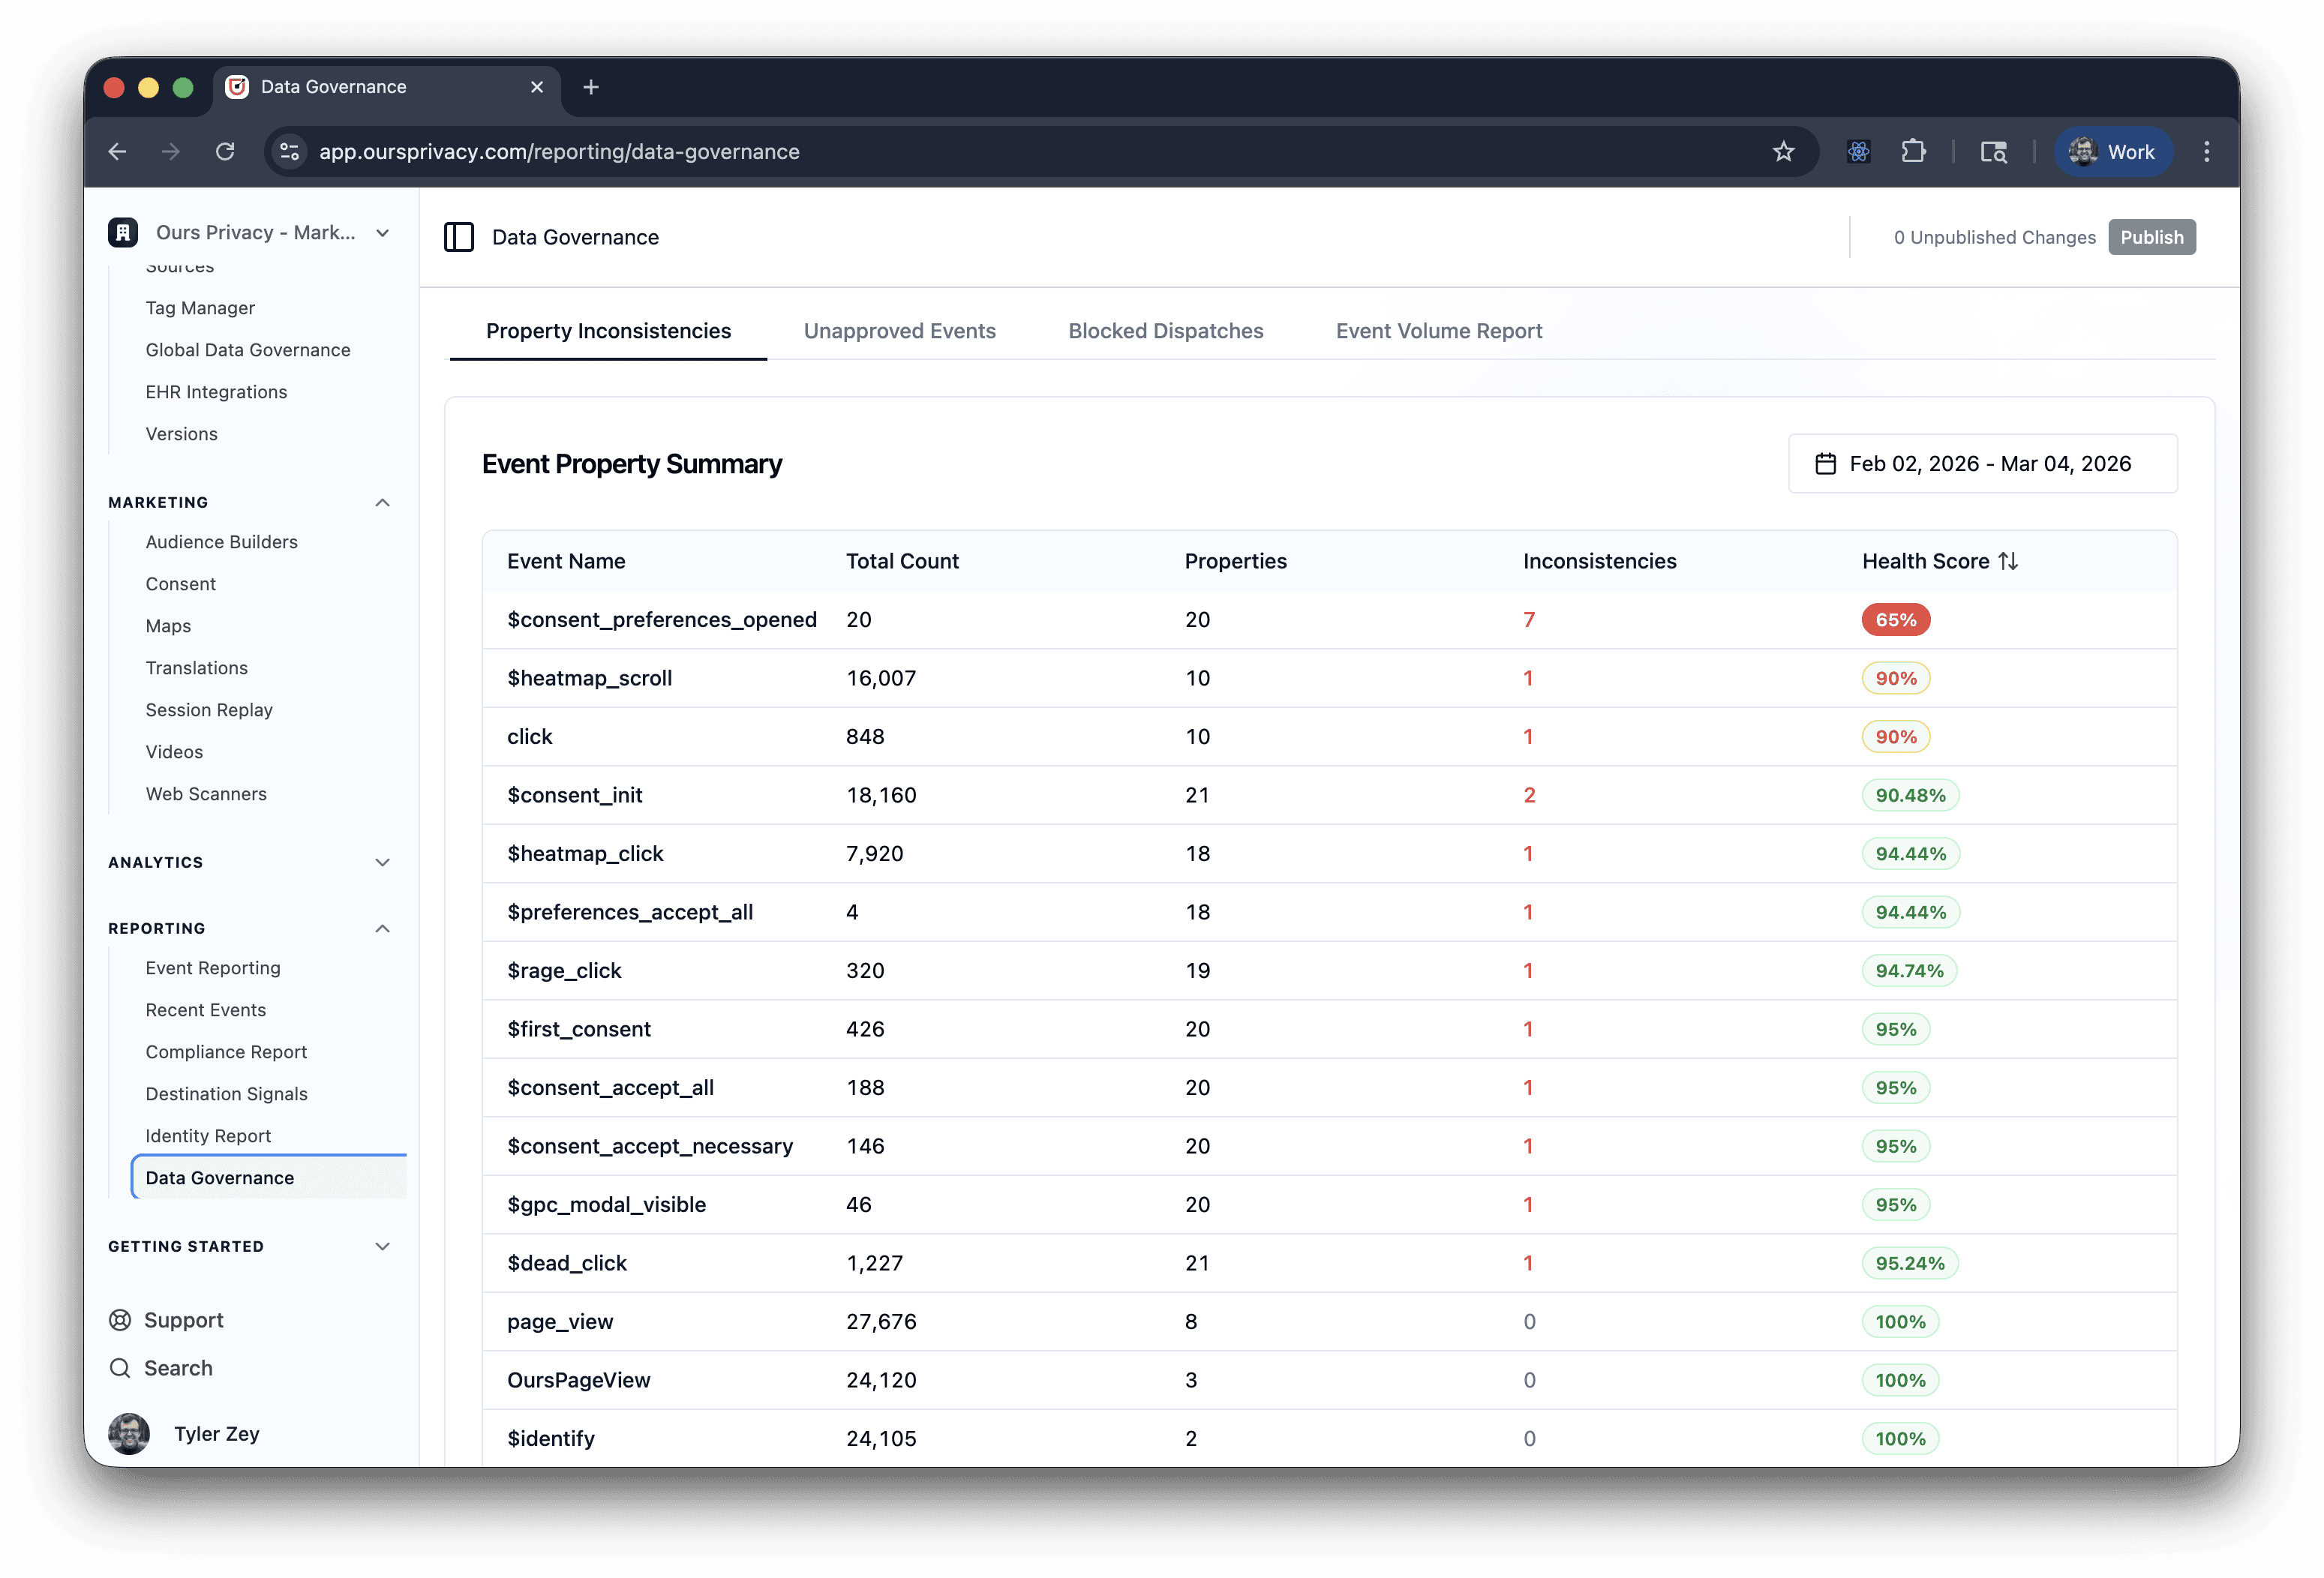
Property Inconsistencies shows every event in your account with a per-property breakdown. For each property on each event, you see coverage (what percentage of events include it), type distribution (string vs. number vs. boolean), and distinct value count. The system flags two patterns automatically:
Low coverage means a property appears on less than 90% of events, so some events are missing data they should have
Type inconsistency means the dominant data type dropped below 95%, so something upstream is sending the wrong type
Click any event to open a detail drawer with the full property audit.
Event Volume Report tracks volume trends across your entire event stream with automatic anomaly detection. Each event gets compared against its 7-day rolling average, and the system assigns one of four statuses:
Critical means volume dropped to zero when the baseline was non-zero (something broke)
Warning means volume fell below 50% of baseline
Spike means volume jumped above 200% of baseline
Normal means volume is within expected range
Toggle between hourly (up to 14 days) and daily (up to 90 days) granularity. Header rows summarize the anomaly count per period so you can scan for problems quickly.
Ingest rules prevent bad data from entering your system. Anomaly detection catches the things rules can't: schema drift, broken instrumentation, and unexpected volume changes, before they corrupt your analytics or downstream destinations.
Destination Signals
When you dispatch events to ad platforms, those platforms need specific attribution signals to match conversions back to campaigns. A Facebook conversion without an FBC cookie, or a Google Ads conversion without a GCLID, still gets sent, but the platform can't use it. You're paying to collect and dispatch data that isn't doing anything.
Destination Signals is a per-destination report that shows exactly how well-equipped your dispatched events are.
What it shows:
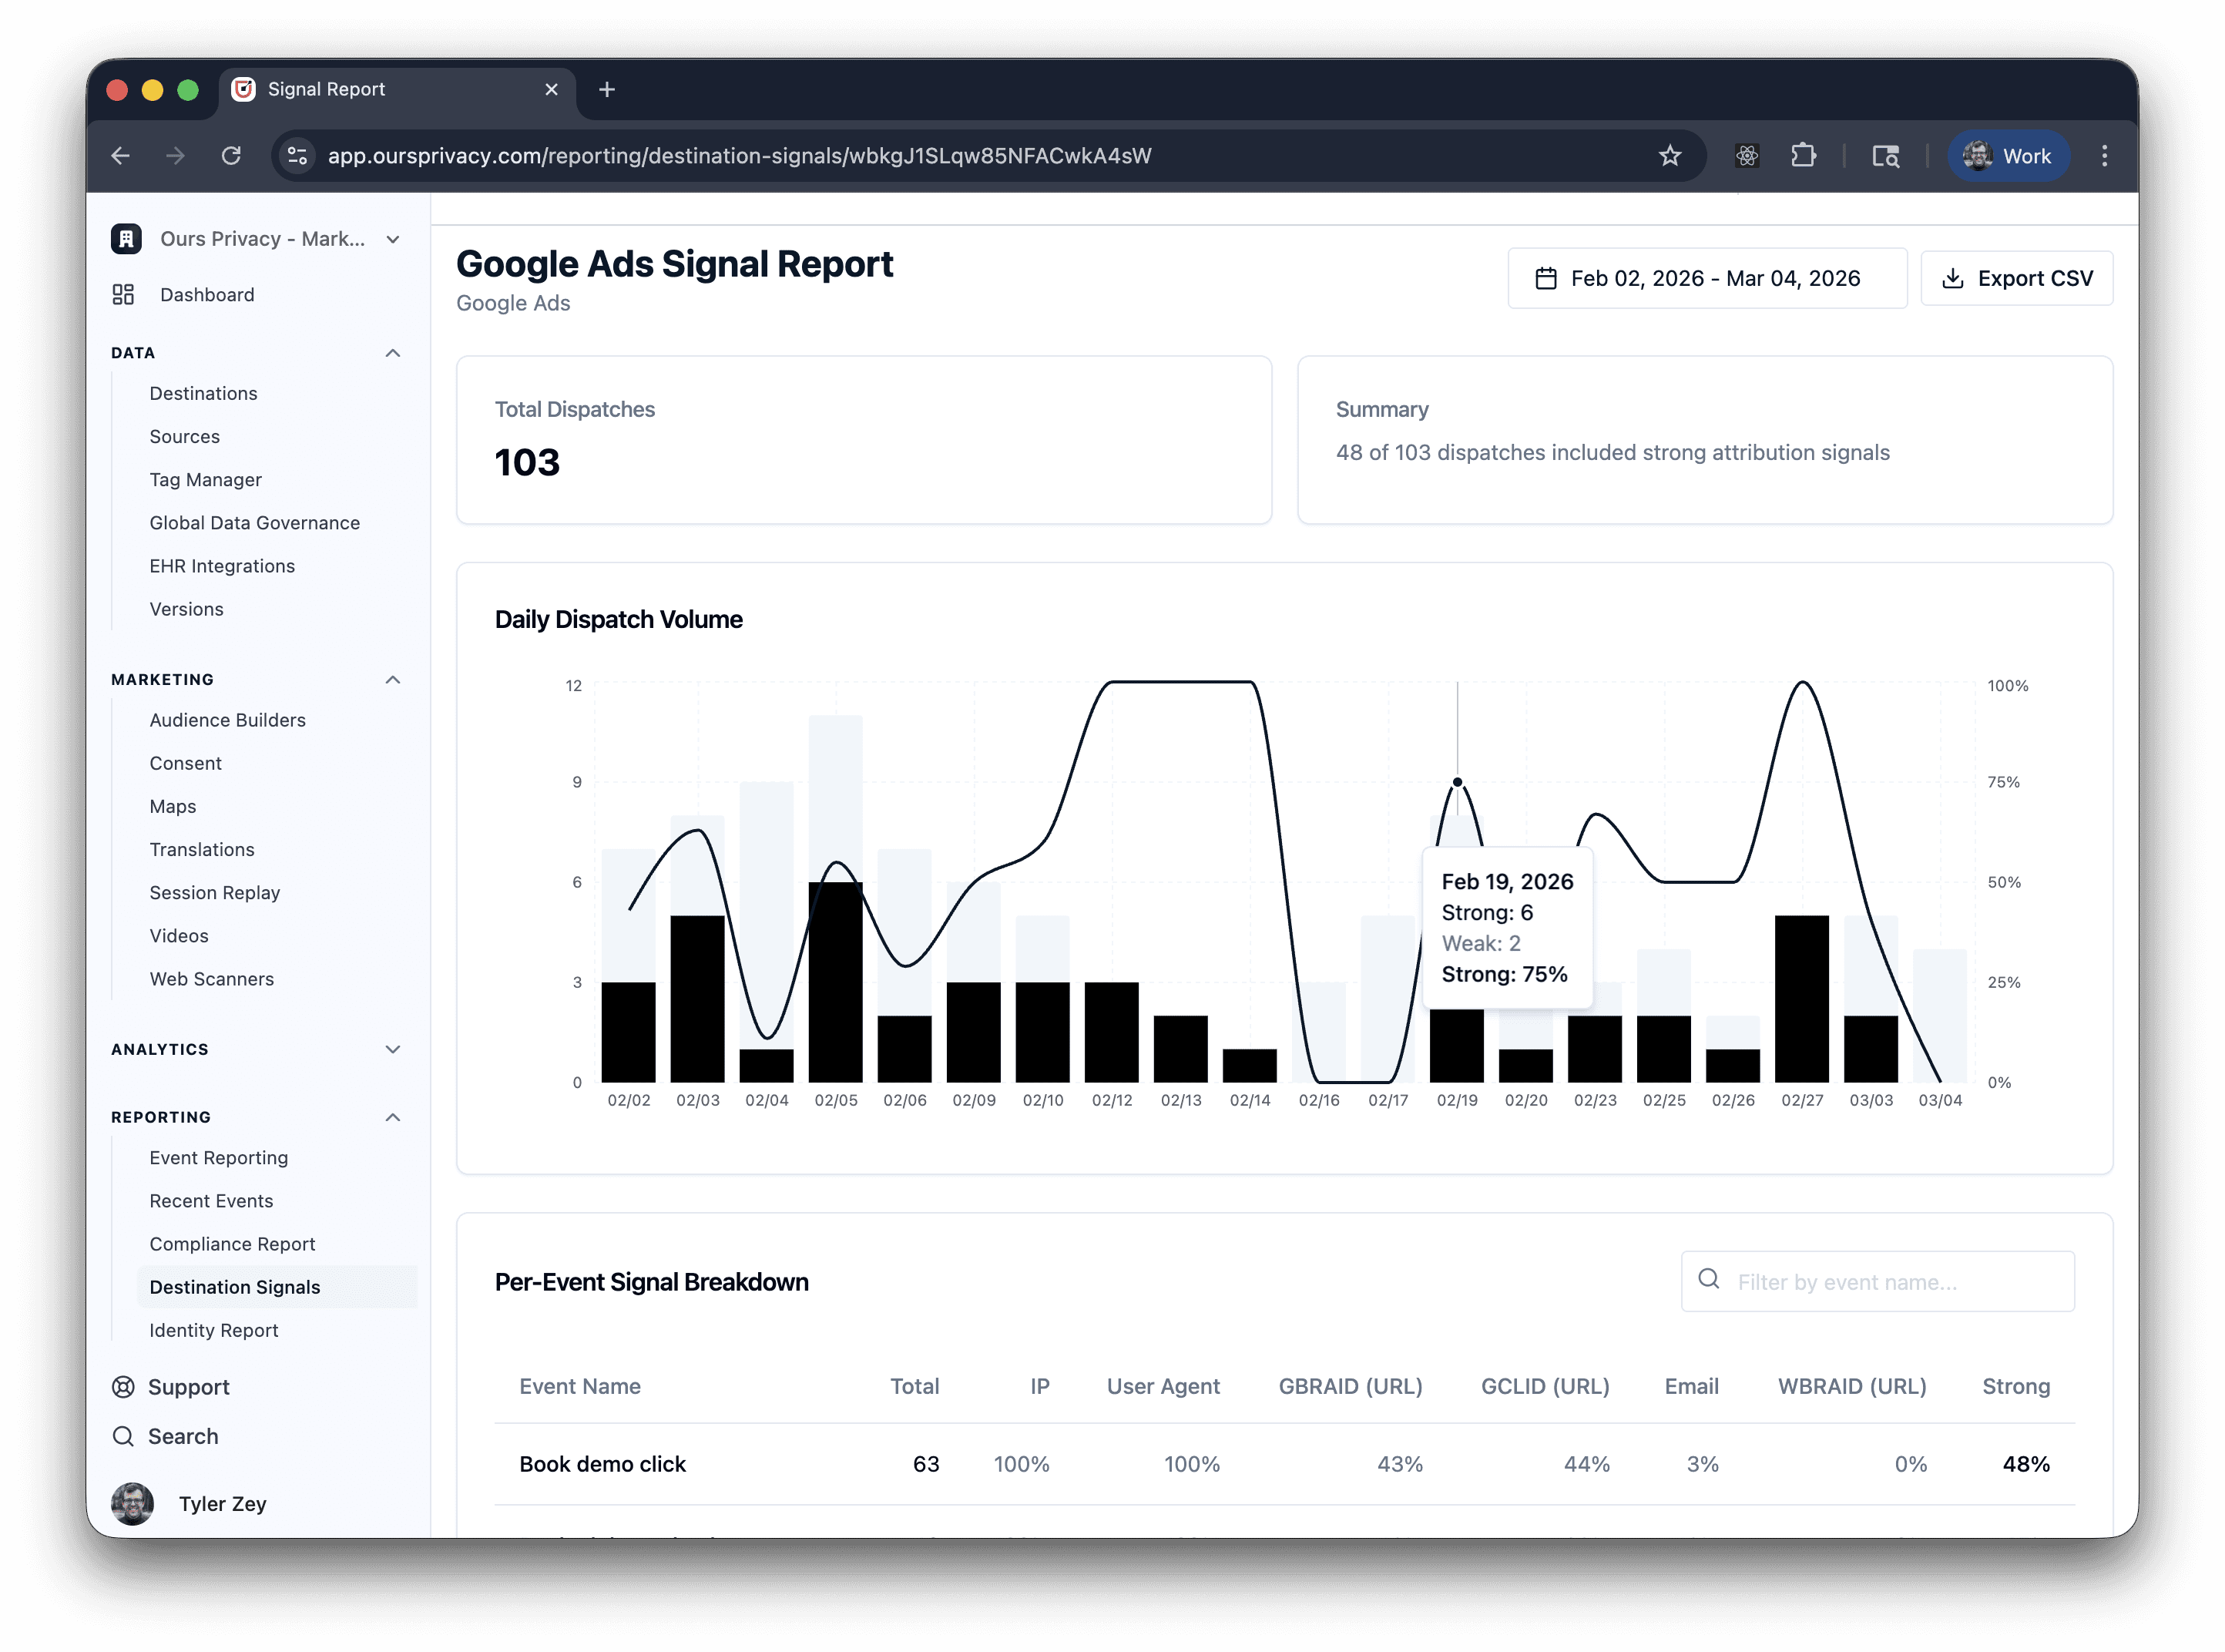
Summary cards with total dispatches and how many carried strong attribution signals
Trend chart showing strong vs. weak signal volume over time, up to 31 days. Click any date to jump to the raw events for that day.
Per-event signal breakdown as a searchable table where each row is an event name, showing the percentage of dispatches that included each signal. Columns are sorted by coverage so the strongest signals appear first.
Signal definitions are destination-specific. For Facebook, it checks FBC, FBP, email, phone, IP, and user agent. For Google Ads, it checks GCLID, GBRAID, WBRAID, email, and IP. Each destination gets a report tailored to the signals that actually matter for attribution.
When your media team asks "are our conversions actually getting attributed?" you have a direct answer. Not a guess based on platform-side reporting, but a signal-level audit from your own pipeline.
Heatmap Export and Top Elements
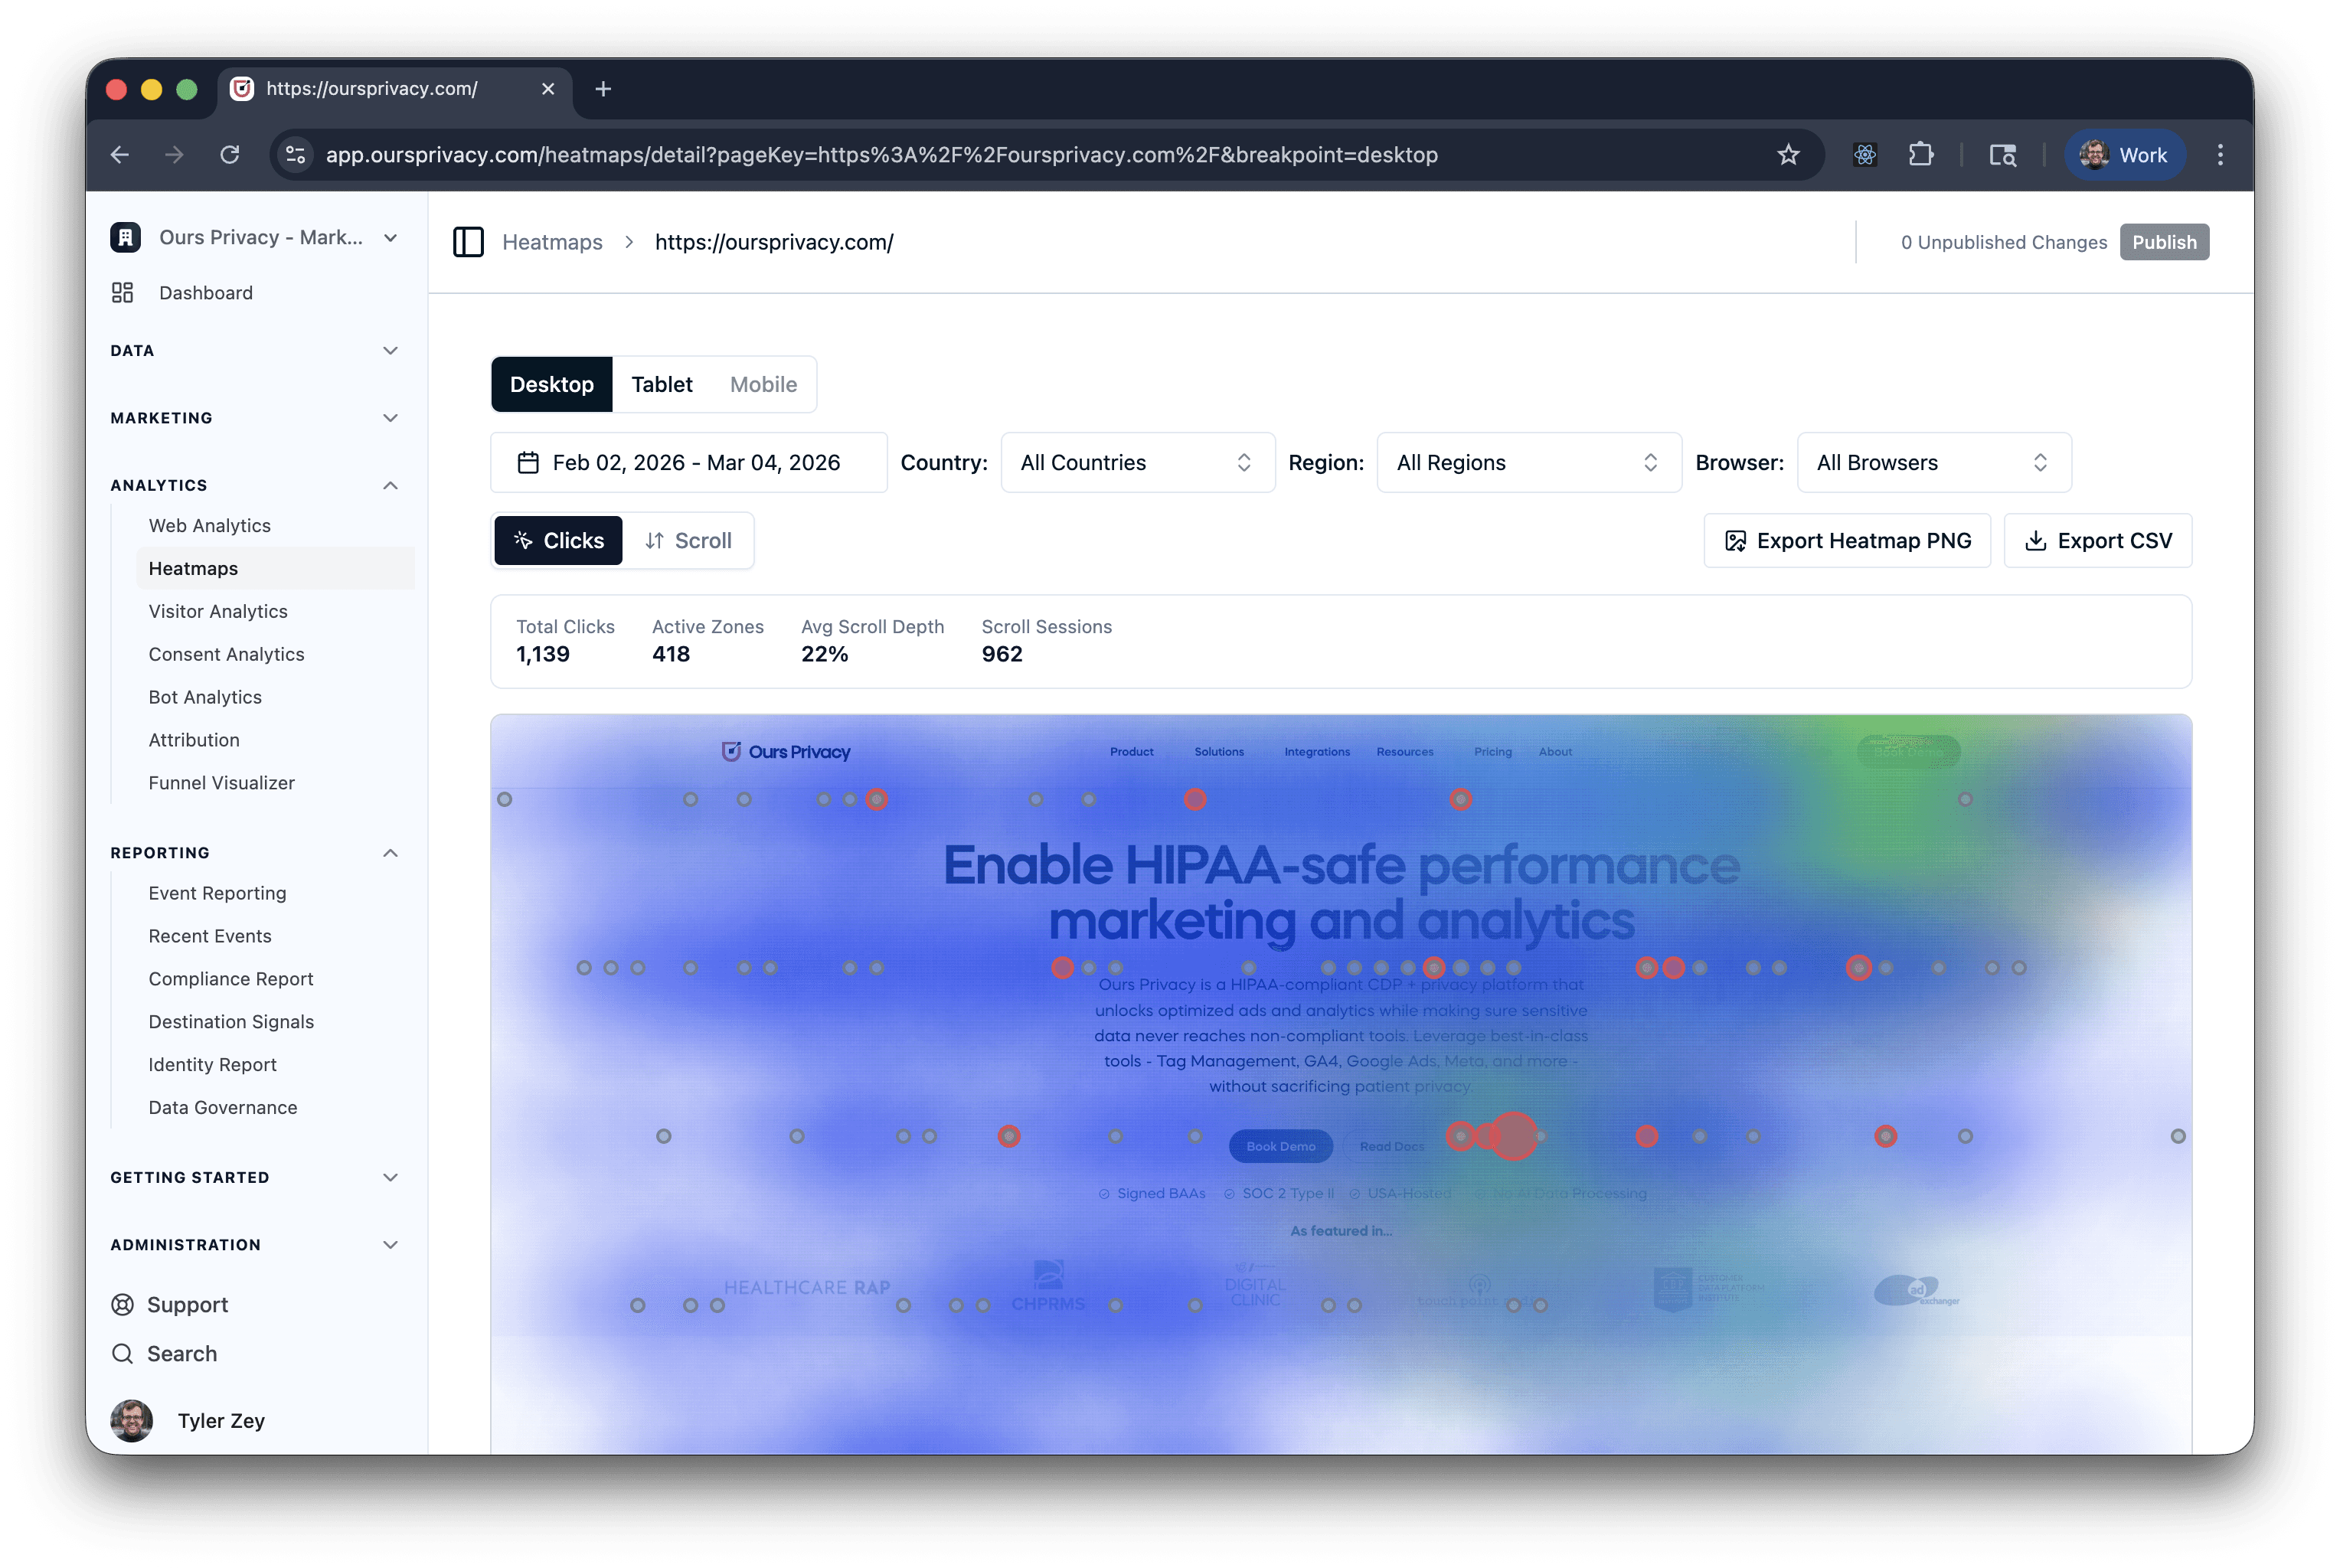
Two improvements to heatmaps this release. You can now export any heatmap overlay as a PNG image, and a new Top Elements card shows the five most-clicked elements ranked by click count.
The PNG export composites the heatmap overlay on top of the page snapshot into a single image. Share it in Slack, drop it into a deck, or attach it to a report. No screenshots, no cropping, no login required.
Top Elements answers the question heatmaps leave open: a hot zone spanning a button, a link, and some whitespace doesn't tell you which element got clicked. Top Elements does. Each row shows the element type, label, and click count. The CSV export now includes top_element and element_tag columns too, so you can pull element-level data into a spreadsheet.
Tag Manager Consent Integration
Tag Manager and the consent platform now share a native integration with dedicated triggers and variables that work out of the box.
Seven new consent triggers:
Consent First Consent fires when a visitor makes their very first consent decision
Consent Loaded fires when consent state is available on the page
Consent Change fires when a visitor updates their preferences
Consent Close fires when the consent banner is dismissed
Consent Modal Show / Hide / Ready fires on modal lifecycle events
Five new consent variables:
Consent Type is the decision type (all, custom, necessary)
Accepted Categories lists which categories the visitor accepted
Rejected Categories lists which categories were rejected
Changed Categories lists which categories changed (on consent change events)
Consent Modal Name identifies which modal triggered the event
Use these to build conditional tag firing without any code. Fire your analytics tag only after consent is loaded. Fire your ad pixel only if the visitor accepted marketing. Suppress a tag entirely until the visitor makes a decision. The triggers compose with existing Tag Manager logic, including priority ordering, trigger groups, and variable conditions.
This release also adds tag execution priority. You can now set a numeric priority on each tag to control firing order. Lower numbers fire first. Use it to make sure consent and analytics base code always loads before dependent conversion pixels.
Audiences in Heatmaps and Session Replay
Audiences now flow through to heatmaps and session replay. Build a segment in the Audience Builder, then view heatmaps or session recordings filtered to just that audience.
How it works:
From any audience detail page, click "Session Replays" or "Heatmaps" to jump directly to the filtered view
All heatmap data (clicks, scroll depth, rage clicks, dead clicks) filters to only visitors in the audience
Session replay lists filter to only show recordings from visitors matching the audience definition
CSV exports from filtered views include only the audience-scoped data
See how your highest-value audience interacts with a landing page. Compare heatmaps for consented vs. non-consented visitors. Watch session replays from visitors who dropped out of a funnel. The audience definition is applied as a query filter, so it works with any audience you've already built.
What's Next
We're in the final stretch of a major infrastructure upgrade to our web analytics engine. The underlying query layer is moving to a much faster database, which means the dashboards you already use (unique visitors, pageviews, bounce rate, session duration, pages breakdown) will load significantly faster. Same data, same UI, dramatically better performance. More on this soon.
Data Governance is getting deeper. The anomaly detection shipped here is the first step toward automated alerting, so instead of checking a dashboard, you get notified when something breaks. Heatmaps are moving toward element-level drilldown, where clicking a top element will show you the sessions that clicked it. And the audience cross-product pattern (audiences into heatmaps and replay) is expanding to funnels and attribution next.
For setup and technical details, see our documentation.
Want to see any of this in action? Book a demo.
Related Articles
Newsletter
Stay up to date
Subscribe for privacy news, feature updates, events, etc.
